
Builder & Society Page Redesign
Enhancing engagement and lead conversion for NoBroker’s project ecosystem
OVERVIEW
Modernising NoBroker’s Builder and Society detail pages to make key details clearer and help users move forward with confidence.
Role
Product Designer
Team
Me, 3 Product Managers, Design manager
Timeline
Sep 2024 - Dec 2024
Resposibilities
Research synthesis
UX design
Visual design
Design Integration
Developer handoff

GET_FLOOR_PLAN, PRICE_REQUEST and SHOW_INTEREST CTA leads grew by 70%.
CLAIM_BENIFITS and CONNECT New CTA generate ~350 leads weekly.
PRICE_Request CTA contribute 30% of total leads.
35%
Increase in Lead-to-meeting schedule rate
40%
Increased leads
WHERE IT STARTED
Issues in the Existing Detail Page
Key project details were buried below the fold, the interface was outdated, and user flows didn’t align with modern expectations.
Our Approach
Looking at competitor’s websites to identify best-in-class features and content strategies
Lead generation
Improve Usability
Highlight lead generating elements
Competitive Benchmarking
Content audit & modelling
Component reuse
Design system integration
Improve discovery of important sections
Improve Content
Visual Consistency
Goal
Plan
Effort
UI Redesign
To improve overall leads and lead-to-conversion rate
To follow the design pattern used in recently revamped list page
WHERE IT STARTED
Research
Due to limited time and budget, we relied on data and domain expertise over primary research.
Clickstream data showed highest engagement on the comparison and map sections.
PMs and RMs revealed common buyer queries — possession timelines, builder trust, and pricing.
Lead data confirm
Creating a content model
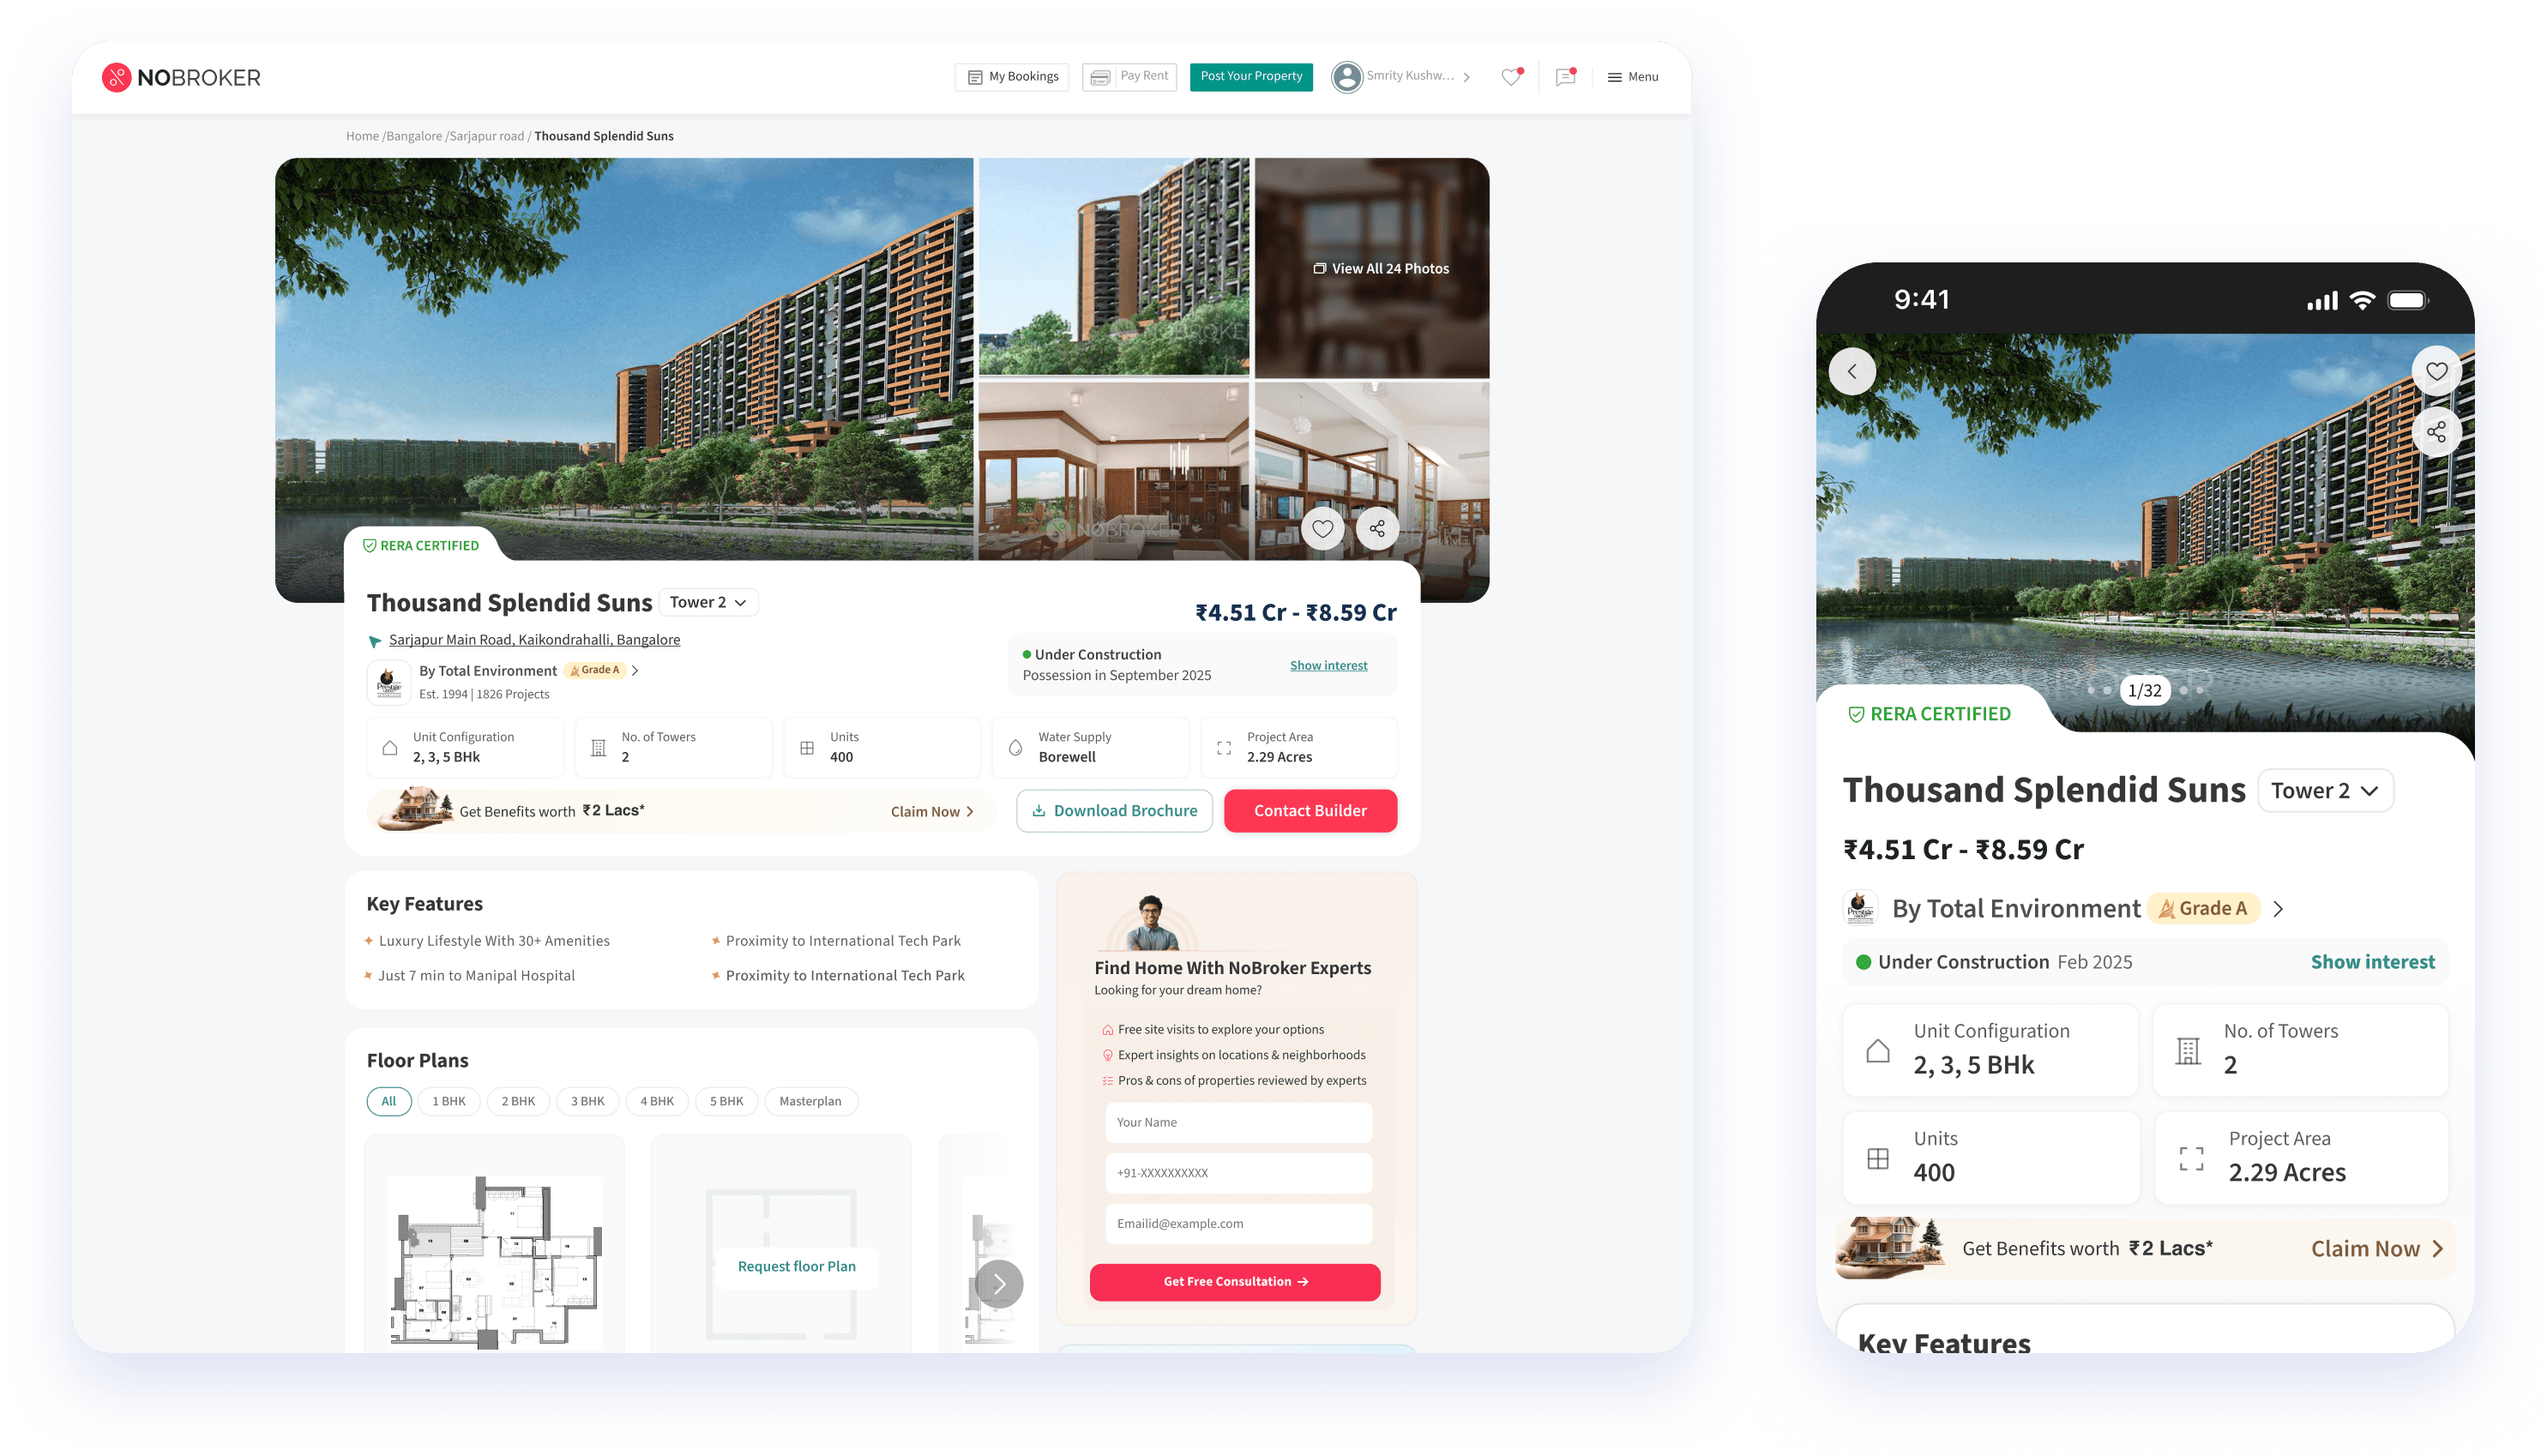
Introduced a Project Card summarizing key project details: possession date, price range, phase navigation, and primary CTAs — all within view at first glance.

Design Principles
To guide decisions and maintain focus, I defined three principles:
Clarity over volume — Surface only the most actionable information up front.
Context builds trust — Integrate builder credibility and project transparency early.
Scalable by design — Adapt layouts to work seamlessly across small societies and large projects.
These principles became the foundation for every decision.
Reframing the First Fold
Introduced a Project Card summarizing key project details: possession date, price range, phase navigation, and primary CTAs — all within view at first glance.
Floor Plans Made Actionable
Added BHK-type filters and integrated the masterplan within the same view. This gave users clarity and control without scrolling or navigating away.
Builder Section: Building Trust Visually
Transformed a text-heavy section into informational cards displaying
Builder grade and Completed projects
This immediately established reliability and reduced cognitive effort.
Simplifying Location Discovery
Replaced nested filters like Transit → Bus Stops with explicit, visible options. Improved discoverability and engagement through clarity.
Smarter Project Comparison
Redesigned both the interface and logic:
New users saw comparisons within a similar price range.
Returning users saw projects they previously interacted with.
Also added “Add to Compare” for better user control.
Neighbourhood Information
Redesigned both the interface and logic:
New users saw comparisons within a similar price range.
Returning users saw projects they previously interacted with.
Also added “Add to Compare” for better user control.
Design System Integration
Reused components from NoBroker’s new design system and built flexible templates for new modules. This minimized dev rework, ensured consistency, and supported long-term scalability.
Cross-functional Collaboration
With PMs: Analyzed lead data to prioritize possession and pricing details. With Developers: Identified reusable components to meet sprint deadlines efficiently. This collaboration balanced business objectives, design intent, and technical feasibility — ensuring impact without scope creep.
Impact
MetricOutcomeGET_FLOOR_PLAN, PRICE_REQUEST, SHOW_INTEREST leads↑ 70%New CTAs (CLAIM_BENEFITS, CONNECT)~350 leads/weekLead-to-meeting schedule rate (project pages)↑ 35% (7.23% → 9.76%)Society page leads↑ 40%Society page conversion (meeting schedules)↑ 67.6% (3.36% → 5.6%)PRICE_REQUEST CTAAccounted for 30% of total leads
Key Learnings
Great design is data-informed, not data-driven — numbers should guide empathy, not replace it.
Scalability isn’t only about reusable components; it’s about structuring information that adapts to different contexts.
Even without direct user research, strong collaboration and data interpretation can lead to evidence-based design.